
Introduction
In the rapidly evolving world of cryptocurrency, trading strategies must constantly adapt to changing market dynamics. As of 2024, significant losses totaling around $4.1 billion were attributed to DeFi hacks, highlighting the importance of effective trading tools. One such tool, the MACD indicator, has emerged as a crucial component for many traders aiming to thrive in the volatile crypto landscape. In this article, we will explore how the
Understanding the MACD Indicator
The Moving Average Convergence Divergence (MACD) is a trend-following momentum indicator that shows the relationship between two moving averages of a security’s price. It was developed by Gerald Appel in the late 1970s and has since become a staple among traders. It comprises three components:
ong>MACD Line: ong> The difference between the 12-day and 26-day exponential moving averages (EMA).ong>Signal Line: ong> The 9-day EMA of the MACD line.ong>Histogram: ong> The difference between the MACD line and the Signal line, visualizing momentum.
Understanding these components is essential for effectively utilizing the MACD indicator in crypto trading.
The Mechanics of the MACD Indicator
To grasp how the MACD indicator functions, let’s break it down further:
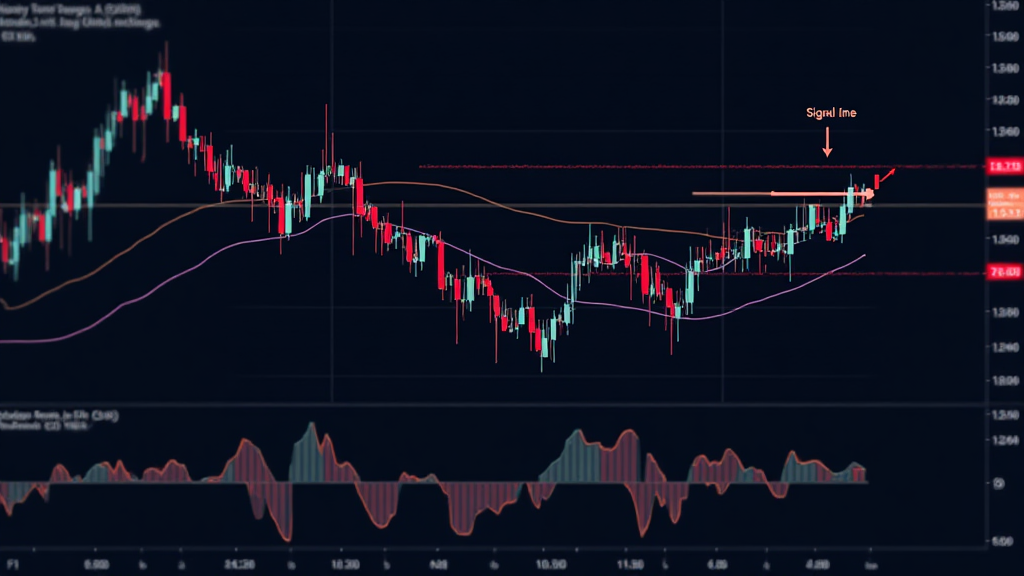
ong>Signal Crossovers: ong> One primary method of trading using the MACD is through the crossovers between the MACD line and the Signal line. When the MACD line crosses above the signal line, it generates a bullish signal (indicating potential buy), while a crossover below suggests a bearish trend (indicating potential sell).ong>Divergence: ong> Divergence occurs when the price of the cryptocurrency moves in the opposite direction of the MACD indicator. For instance, if the price is making new highs while the MACD is failing to do so, it may indicate a potential reversal.ong>Overbought and Oversold Conditions: ong> The histogram can provide insights into overbought and oversold conditions. Extreme highs might indicate that the asset is overbought, while extreme lows may point to oversold conditions.
By employing these strategies effectively, traders can enhance their decision-making processes, especially in a market ripe with opportunities.
Applying the MACD in Crypto Trading
Implementing the MACD indicator involves several key steps. For instance, the implementation can look quite similar to navigating through investment waters—just like how you wouldn’t sail without a compass, trading should not happen without using reliable indicators like MACD:
ong>Set Up Your Charts: ong> Most trading platforms offer the MACD as a built-in indicator. Ensure to set it to the standard parameters, or customize them based on your strategies.ong>Combine with Other Indicators: ong> While the MACD provides valuable insight, it is best used in conjunction with other indicators to confirm signals. Popular companions include the Relative Strength Index (RSI) and Bollinger Bands.ong>Monitor Market Conditions: ong> Keep a close eye on overall market trends. Bullish or bearish market phases can greatly affect the outcomes of signals generated by the MACD indicator.
By following these steps, traders can begin to master the MACD indicator, significantly improving their trading strategies moving forward.
The Future of MACD in Crypto Trading
As the crypto market continues to evolve, the role of indicators like the MACD is expected to be paramount. According to industry insights, the growth rate of cryptocurrency users in Vietnam has increased significantly, demonstrating an appetite for sophisticated trading solutions. With the impending popularity of cryptocurrencies in emerging markets, traders must adapt their strategies to maintain competitiveness.
Fostering a blend of technical analysis and market awareness will be essential in the years ahead. Here’s the catch: understanding the MACD is not just about acknowledgment; it necessitates real-world practice and strategy refinement.
Case Study: MACD in Action
Let’s consider a real-world scenario where the MACD effectively influenced trading decisions:
ong>Scenario: ong> A trader noticed the MACD crossover on Bitcoin (BTC) as it surged from $30,000 to $45,000 over a three-month period.ong>Action: ong> Upon identifying a bullish crossover, the trader entered a long position, benefiting from the uptrend.ong>Outcome: ong> As Bitcoin reached overbought conditions according to the histogram, the trader exited the position, securing profits.
This scenario highlights how the MACD indicator can offer timely insights into potential trading opportunities.
Common Mistakes When Using the MACD Indicator
Even experienced traders can make mistakes when relying too heavily on any one indicator. Here are common pitfalls to avoid:
ong>Ignoring Market Context: ong> Just as one wouldn’t drive without looking at the road, trading without considering market conditions can lead to losses.ong>Overtrading: ong> It’s tempting to act on every signal generated by the MACD; however, waiting for confirmation from other sources can prevent rash decisions.ong>Neglecting Risk Management: ong> No matter how well a strategy appears, a robust risk management protocol remains essential.
By acknowledging and avoiding these mistakes, traders enhance their risk-reward profiles and contribute to their longevity in the market.
Conclusion
In summary, the MACD indicator is a powerful tool for navigating the complexities of cryptocurrency trading. Its ability to signal momentum shifts, combined with its interpretative nature, makes it a valuable asset in a trader’s toolkit. As the crypto landscape continues to shift, particularly with the expected growth in emerging markets like Vietnam, adapting to tools such as the
Embracing innovative strategies will undoubtedly yield promising outcomes in the exciting world of digital currencies. As 2025 approaches, leveraging tools like the MACD will be crucial for achieving trading success.
Author: Dr. Ethan Aspen, a financial analyst specializing in cryptocurrency trading strategies. He has authored over 15 research papers on trading indicators and led audits for blockchain projects worldwide.

